Overview
Configuring BI Connections through EHS Insight's Business Intelligence Module provides an easy-to-use process to seamlessly integrate EHS Insight's data with BI tools like Power BI and Excel.
Users can effortlessly identify and export critical data sources such as incident reports, compliance data, and operational metrics stored within EHS Insight for real-time analysis and comprehensive reporting.
The BI connector simplifies the connection process, enabling both BI User and BI Developer roles. BI User access allows users to connect using their existing permissions, facilitating intuitive data exploration beyond standard reports. The BI Developer role offers users unrestricted access to all EHS Insight data, empowering them to build customized dashboards and delve into raw data.
This user-friendly interface ensures quick and efficient establishment of connections, enhancing analytical capabilities across the organization.
BI User
In EHS Insight
PREREQUISITE: Users must have "Business Intelligence - BI User" role enabled to configure BI Connections as a BI User.
In order to configure a BI Connection as a BI User:
- Navigate to My BI Dashboard under My Profile
- Select the Report you wish to make the BI Connection
- Set up the Parameters to restrict how much data you import into your BI tool

- Choose the Authentication Type
 NOTE: URL Embedded is quick and easy. Basic Authentication is more secure and makes rotating your personal access token easier later
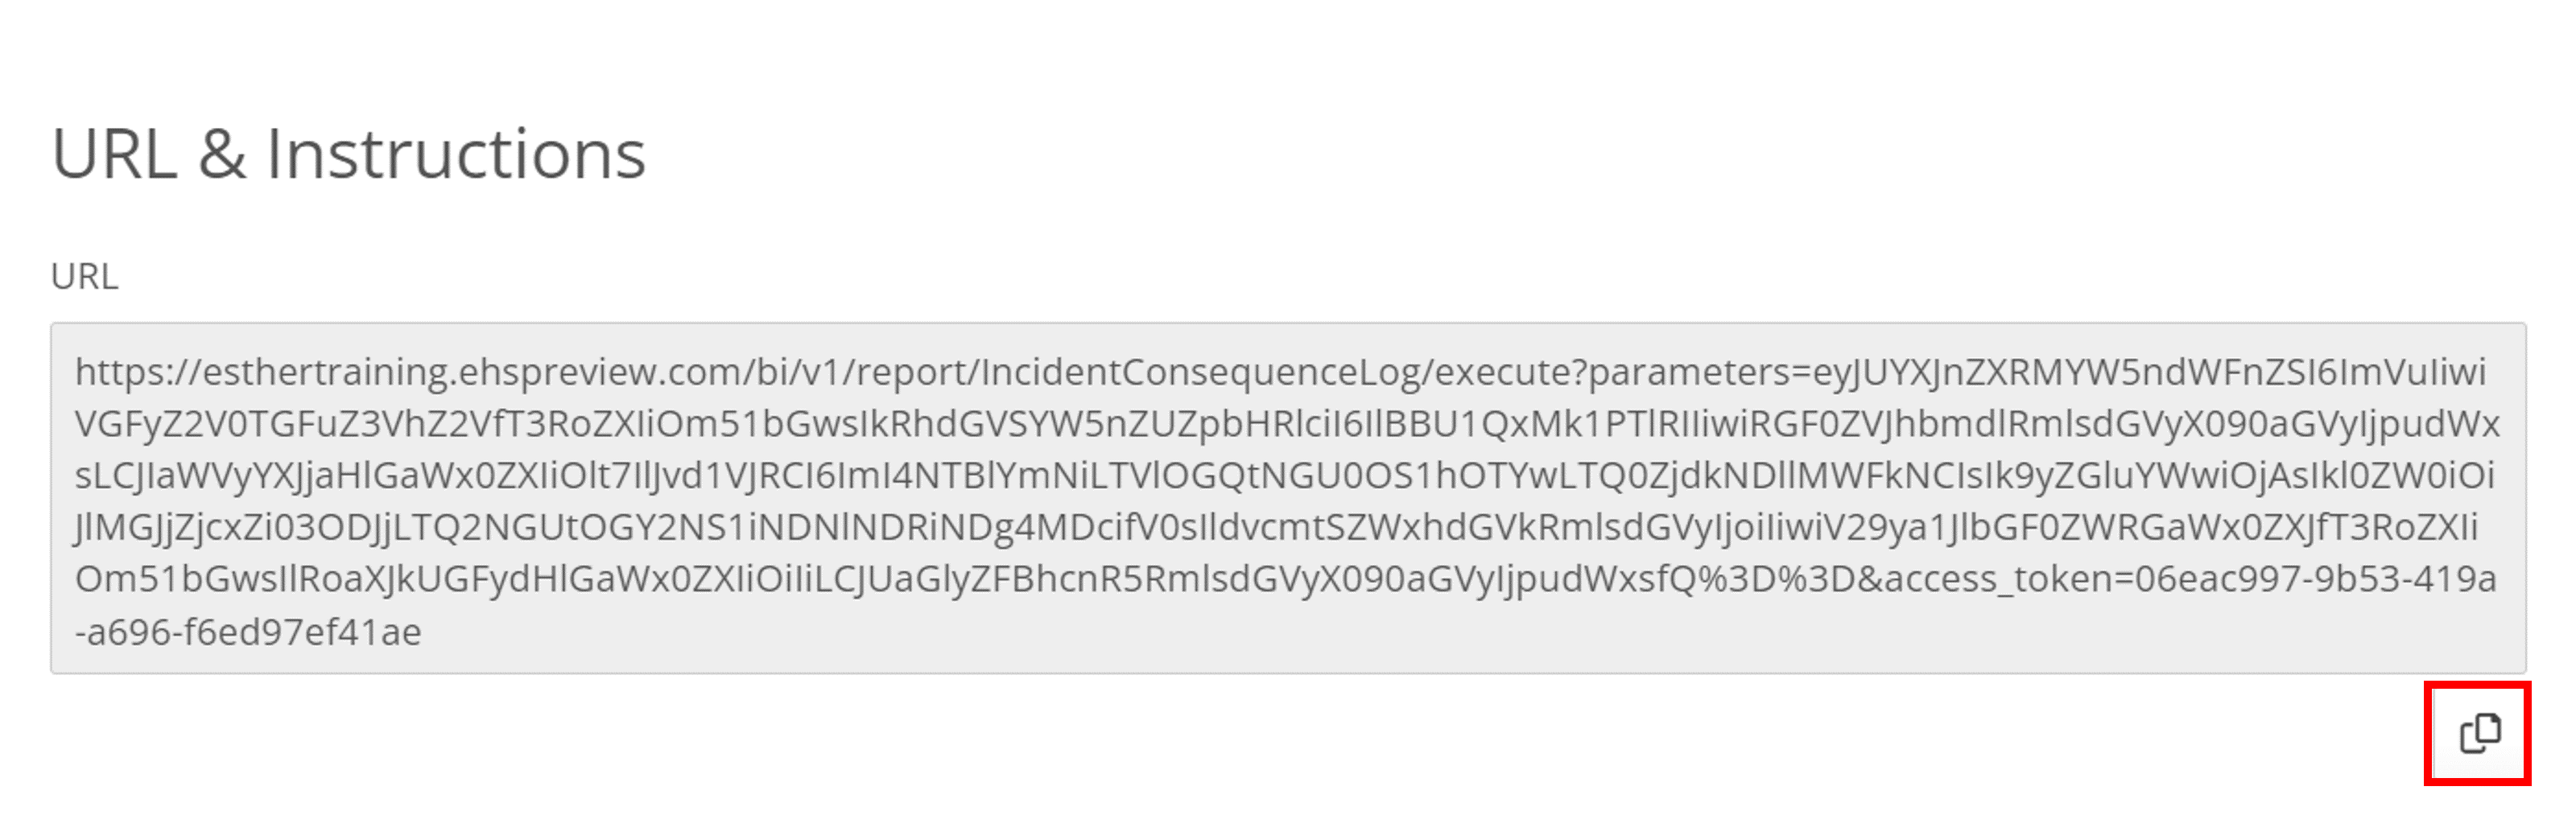
- Select the Copy button under the URL
In Power BI Desktop
- Select Get Data From Other Sources
- Type Web and select Web
- Paste the URL
- If you left Authentication Type set to URL Embedded, and you are prompted here, just leave it default.
- If you changed the Authentication Type to Basic Authentication, select Basic and input the Personal Access Token displayed back in EHS Insight as the Password.
- Power Query Editor will display a preview of the data
- Optionally you can manipulate how the data is imported
- Optionally change the Name in the Properties sidebar to the name of the report
- Select Close & Apply
- Power BI will now display its main view
- Select and drag the type of Chart you wish your report to display from the Visualization sidebar
- Drag the Data you wish your Report to display from the Data sidebar
BI Developer
In EHS Insight
PREREQUISITE: Users must have "Business Intelligence - BI Developer" role enabled to configure BI Connections as a BI Developer.
PREREQUISITE: In order to utilize the BI Developer with a Site AP Key, you must first create a Read Only Site API Key using Administration - API Settings.
In order to configure a BI Connection as a BI Developer:
- Navigate to Administration - Business Intelligence (or My BI)
- Select the Report, Form, List, or Document Library you wish to make the BI Connection
- From Source select root or child relational data

- Filter the data you wish to import into your BI tool

- Choose the Authentication Type
- If Basic Authentication is selected, choose the Type of API Key

- If Site API Key is selected, choose your Site API Key in the drop-down
- Select the Copy button under the URL
In Power BI Desktop
- Select Get Data From Other Sources
- Type Web and select Web
- Paste your URL
- Select Basic and input your Site API Key as the Password
- Power Query Editor will display a preview of the data
- Change the Name in the Properties sidebar to Incident Event
- Select Close & Apply
Further Developer Actions
Once the first Data Connection is made, the BI Developer will typically import other relational raw data. Once multiple raw data tables are imported, the BI Developer can start using the Modeling menu to add relationships (foreign keys) to create the Data Analysis Report or Company Dashboard as desired.
Special Instructions for Excel
Excel’s version of Power Query is less automatic than Power BI
- Create a new Excel Document
- Select the Data tab and select Get Data - Web
- Paste a URL from EHS Insight
- When Power Query loads, you will see just a list of Records, not expanded as columns
- Select To Table in the toolbar and select OK in the modal confirmation
- In the main view, select the expand icon in the Column1 column header and select OK in the confirmation
- You will now see the expected columns
- Select Transform and then Detect Data Type to improve dates and numeric columns
- Select Close and Load
- You will now have a live-connected sheet in Excel, similar to Power BI
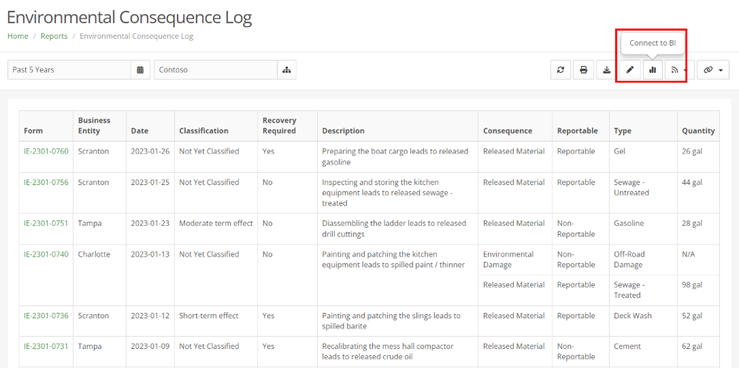
Access to the BI Connection modal Directly from Reports
- Navigate to Reports in the Navigation Menu
- Select the Report you wish to make the BI Connection
- Select the BI Connector button in the toolbar to quickly access a connect any report to Power BI or Excel